Urban Sprawl - A Case Study of La Crosse, WI

Written November, 2002
"Here is a town of twelve or thirteen thousand population, with electric lighted streets, and with blocks of buildings which are stately enough, and architecturally fine enough to command respect in any city. It is a choice town and we made satisfactory use in roaming it over"--Mark Twain on La Crosse, Wisconsin 1882
La Crosse, Wisconsin is a very unique city. Its location on the Mississippi river was a key factor during the early days of development. As time passed, however, many social, political, and physical changes occurred throughout the city. Nowadays, most city streets and new developments in La Crosse look similar to those found in nearly even other American city. Wide streets with no sidewalks, large building setbacks, and houses with three or more garages are commonplace. These types of developments constitute a phenomenon known as "urban sprawl". This is certainly a drastic change from the city that Mark Twain visited during his days as a steamboat captain. The city has been expanding since it was founded in 1841, but the rate of expansion has not remained constant (Hirshheimer 11). This paper will examine the years in which La Crosse experienced the most urban sprawl and then go on investigate its causes and effects.
List of Appendices
Appendix A Earliest Settlements, 1848 Appendix B Graph - Population of the City of La Crosse Appendix C Graph - Area of the City of La Crosse Appendix D Graph - Population of the La Crosse area Appendix E Graph - Area of the City vs Surroundings Appendix F Graph - Per Capita Area Appendix G Graph - Population Density Appendix H South side of La Crosse Aerial Photo 1938 Appendix I South side of La Crosse Aerial Photo 1954 Appendix J South side of La Crosse Aerial Photo 1962 Appendix K South side of La Crosse Aerial Photo 1962 Appendix L South side of La Crosse Sanborn Fire Insurance Map 1907 Appendix M City Vision 2000: CBD Master Plan Map Appendix N City Vision 2000: CBD Master Plan Architects Rendering
Methods of Data Collection
To determine the period in time when the most urban sprawl occurred required a good deal of research. The first step was to determine population as a function of time. I used census records from 1860 to the present to determine population. The second step was to determine area of the city as a function of time. This proved to be much more challenging. The area that I was looking for was the total area of developed land. I defined this area in my research prospectus:
"The area of the city will be defined as the area where structures are built plus the area of the land immediately around them that is in use. This surrounding area will include backyards, streets, parking lots, parks within the city, highways and the land surrounding the highways on which building is not permissible (such as the area within a cloverleaf). Exclusions will be farmland and agricultural buildings, except when such buildings have been renovated for purposes other than agriculture, urban parks which maintain an unaltered and natural state (such as an area of forest within the city), and areas where streets have been laid but no structures have been erected."
I was not able to locate this statistic in any books or publications. Because the area that I had defined did not rely on the political boundaries of the city, I had to calculate it myself. I used a series of historical maps of La Crosse and aerial photographs that I found both in the University of Minnesota map library and at the La Crosse Public Library archive vault. For the time period from 1860-1920 I relied primarily on maps drawn by the La Crosse city engineer showing the different wards of the city. The limitation of these maps was that it was not possible to distinguish between areas that were developed and areas that just had new streets laid but no development. I was able to get several sets of aerial photographs starting with 1938. These were very helpful in doing area calculations because it was possible to see whether or not specific areas were developed. From 1950 on I was able to use USGS Quadrangle maps which showed the areas of the city that were developed and many of the structures. These maps allowed me to get accurate measurements of the latest expansions to the city. To ensure accuracy, I used just the 1998 USGS quadrangle to do all of the area measurements on. I outlined the city's development at a specific point in time based on one of the historical maps onto the 1998 map. Then, using a ruler I broke the city down into smaller areas, and began to measure. I then converted the area measured on the map to the actual area of the city using the factor that 1 in2=.1434 mile2 for a 1:28000 scale map. After summing the parts, I was able to compile a graph of area vs. time and to fit a curve.
Explanation of Data Collected
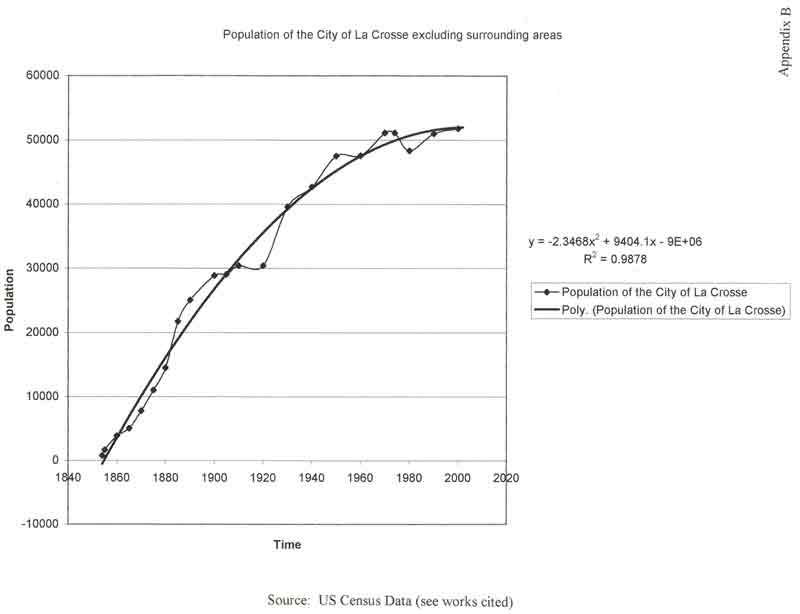
The first graph that I constructed was Population vs. Time. This is located in Appendix B . I was successful in fitting a curve to this data. The curve is a second degree polynomial, and as such would probably not be a good predictor of future population. The R2 value of the curve of population was .9878, so I felt that any extrapolations made on this data would be statistically significant.
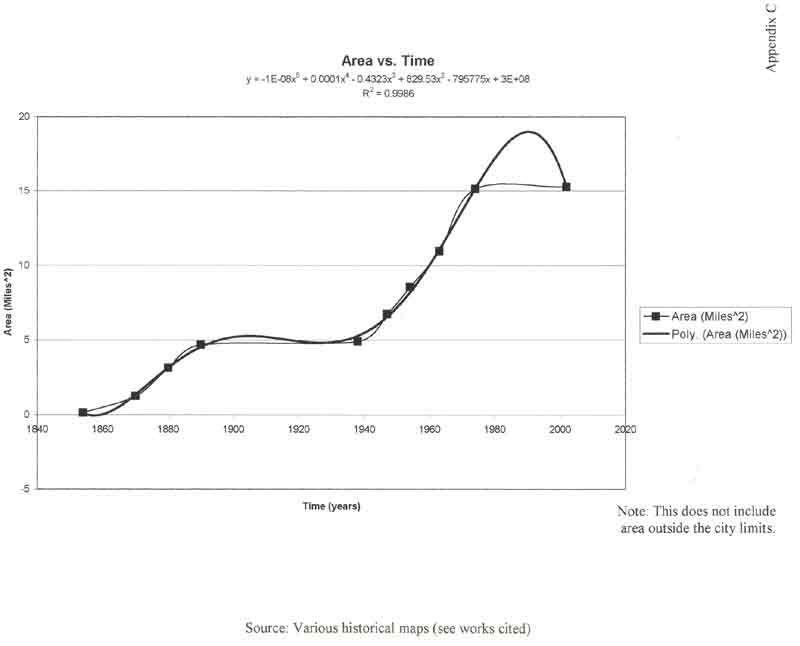
After compiling the area measurements into a graph located in Appendix C, I found that the area of the city did not change as consistently as the population. A sixth order polynomial was required to fit a curve. However, it should be noted again that this curve would not be a good predictor for future growth as it has a sharp spike near the end. Despite this, it has an R2 value of .9986 so it can be considered accurate for extrapolating area during the years from 1860 to 1970.
Both of these graphs were based on the populations and areas for the city of La Crosse only. La Crosse has several surrounding communities that began as separate entities but which are now adjacent and need to be considered for their contributions of population and area. This becomes especially apparent when looking at the last twenty years of both graphs as the city of La Crosse has not experienced significant growth in either population or size since 1980. After researching the historical populations of Onalaska, Shelby, Campbell and Medary I was able to create a graph exhibiting the recent growth of population in La Crosse's suburbs vs. the population of the city of La Crosse. This can be seen in Appendix D. The population of the metropolitan area is essentially the same as that of La Crosse until about 1940 because of the relatively small numbers of people residing outside of the city. In 1940, the population of the suburbs began to grow along with the population of La Crosse. In 1970, the population of La Crosse began to stabilize and then actually declined in 1980 while the population of the suburbs grew higher.
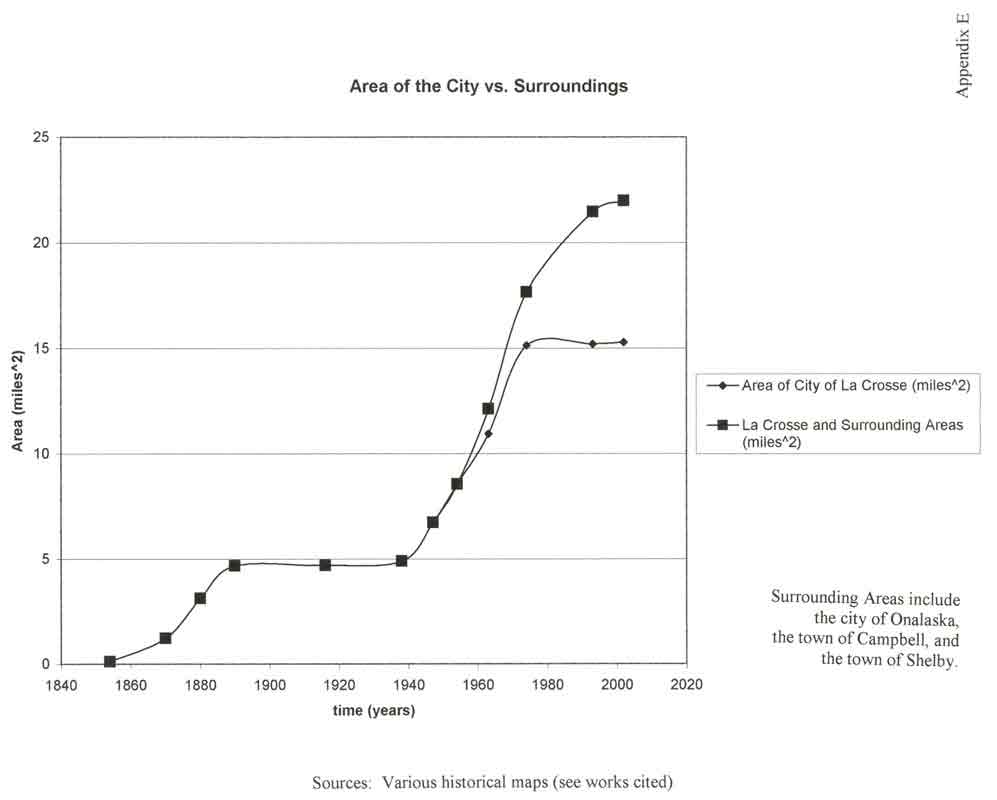
After completing area calculations on La Crosse's surrounding areas, I prepared a graph showing the area of La Crosse vs. the area of La Crosse plus its surrounding areas. This is in Appendix E. The trends on this graph are similar to those on the last graph. The surrounding communities did not contribute significantly to the total area until about 1950. The area of La Crosse leveled off in 1970, while the area of the suburbs continued to increase.
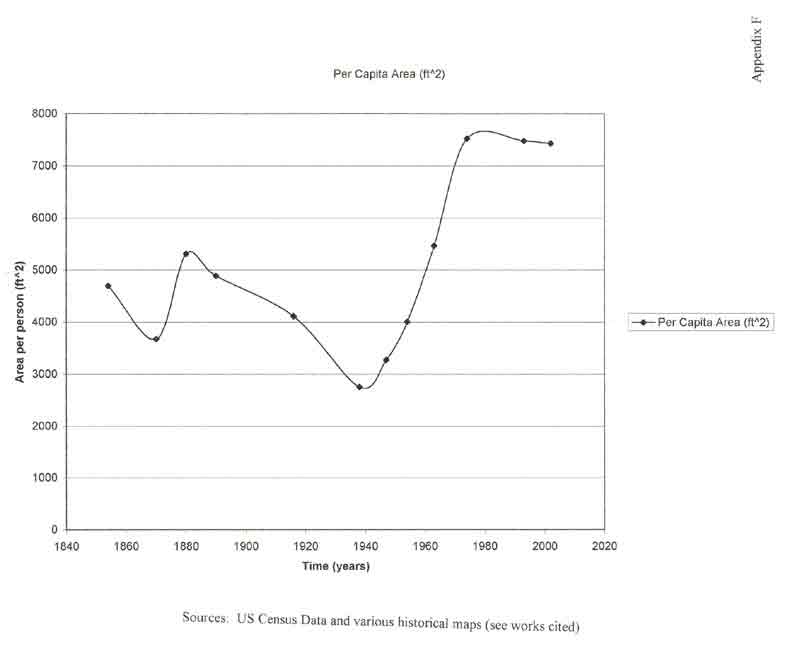
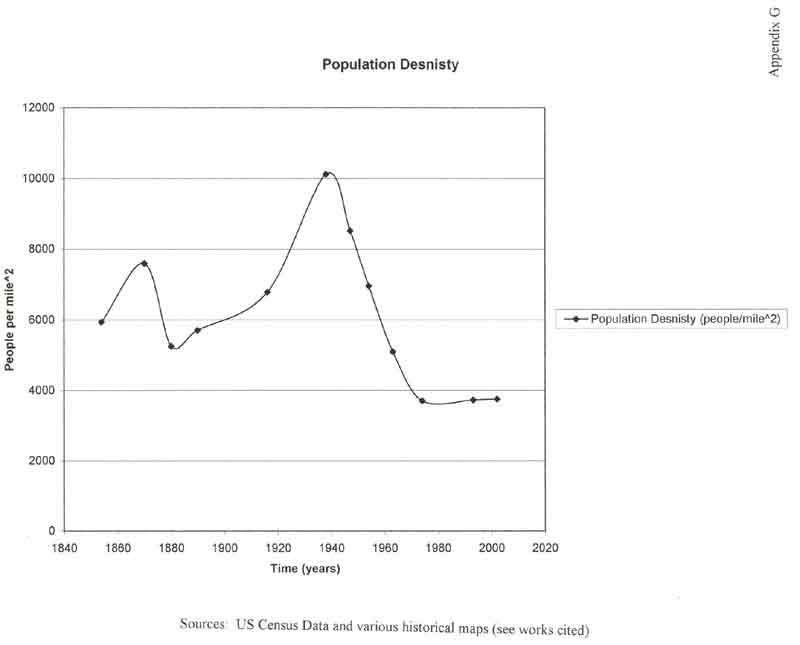
Armed with the new data which incorporated La Crosse and its surrounding communities, I was able to create a per capita land use graph. This can be seen in Appendix F. This was obtained by dividing the area measurements by the population measurements and plotting them against time. Several interesting trends emerged from this graph. First of all, the land use per capita has increased overall 63% since the city was founded and 167% from the all time low in 1935. Second, the land use per capita does not increase consistently, but rather has peaks and valleys. The inverse of this graph shows population density as a function of time. This is Appendix G. It can be seen from Appendix C that the lack of spatial development coupled with an increase in population during the period from 1880-1940 led a constantly increasing population density.
Background
La Crosse has its beginnings as a trading post on the Mississippi. At this time, its only connection to the outside world was via the river (Hirshheimer 53). The earliest settlements were, in some ways, similar to early southern plantations (See Appendix A). They consisted of narrow strips of land with riverfront, extending back away from the river (Hirshheimer 44). The city as we know it today began to develop after 1851 with the introduction of a local sawmill. This brought an increase in population, and an increase in the size of the city.
The reasons for rapid expansion early on were partly due to La Crosses favorable location. La Crosse is located at a bend in the Mississippi River and at the confluence of two other rivers, the La Crosse and the Black. In this way, a very deep natural harbor was provided for the many steamboats that needed to dock. This allowed La Crosse to become a center of trade, which further accelerated its growth. The steamboat traffic grew from 4 boats per year in 1851 to 1312 boats during 1858 (Hirshheimer 133). Another favorable geographic condition was the availability of land. La Crosse is located at a relatively wide spot in the Mississippi Valley, and this provided ample room for future expansion.
La Crosse is located in a unique area. The shape of the city is determined by the river on the west and south and the bluffs on the east. These natural barriers have helped to reduce the extent to which urban sprawl can occur, unlike places with no natural boundaries such as Madison, WI (Daoust, 11). These same barriers have caused the city to become very long and narrow. Also, a large marsh along the La Crosse River has been left undeveloped creating a gap between the north and south sides if the city (see accompanying fold out map). Both of these factors keep population density higher than if the city were to grow unchecked.
La Crosse continued steady expansion, both in population and area, when the first railroad line, the La Crosse & Milwaukee Road, was run into La Crosse in 1858 (Hirshheimer 144). More rail lines followed, and soon La Crosse became home to four major rail lines and a key rail bridge over the Mississippi. This helped fuel economic expansion and ensured La Crosse's dominant position as a center for commerce. The rail lines that were laid out between 1858 and 1890 affected the layout and planning of the city, and most remain to the present day. Railroads helped to bring in waves of immigrants between 1870 and 1890. These immigrants were predominantly German and Norwegian. The population of foreign born citizens got as high as 37% in 1880. La Crosse was promoted in throughout Europe as an ideal location to move to. These immigrants helped to fuel expansion of the city. They helped to develop new neighborhoods around the existing city.
The logging industry began to decline near the end of the nineteenth century when the supposedly "inexhaustible" supply of pine was exhausted (Hirshheimer 172). However, manufacturing jobs were on the rise, so the economic progress of La Crosse was not halted, but shifted in a new direction. La Crosse became home to several industries including a rubber mills, several breweries, and button company. These companies located themselves near the downtown area of La Crosse, along with most other commercial buildings. These industries helped to create a strong central business district and a thriving economy.
Early City Planning
Early city planning in La Crosse made use of the grid system. The earliest grid system was set on a northeast southwest axis by the founder of La Crosse, Nathan Myrick. This area, which is now the central business district, encompasses about 18 city blocks. Further developments were straightened to a north south axis. Each block had sidewalks and an alley. Initially, streets were not paved and sidewalks were wooden (Smalley 11). Lot sizes were small, with no more than 50 feet of road frontage (La Crosse City Atlas (1893)). Houses were relatively close to the sidewalk and to each other. The layout of the city was simple yet effective. Numbered streets ran north-south and began at the river with Front Street, while east west streets were named after various things, especially the names earliest settlers. The grid system made navigation easy, and helped to keep the amount of space devoted to roads to a minimum. The city grew by adding small areas of land immediately adjacent to the existing developed sections and extending existing streets in a grid fashion. The grid in La Crosse is not perfect, and several streets do not quite line up. This could be due to faulty surveying, small variances in property ownership, or lack of control of the city government over developers. Despite this, the city grew up in a structured and centrally planned fashion until about 1940.
Transportation
With the small lot sizes and lack of automobiles, the city developed on a pedestrian scale. The small lot sizes made walking to neighborhood shops and the central business district a short journey. This is where most commercial activity took place and where many people were employed. The absence of automobiles kept traffic to a minimum. Many people utilized mass transit to go longer distances, especially from the north side to the south side. A horse drawn railway began operation in 1879 and became very profitable (Hirshheimer 190). A second horse drawn railway company was founded and eventually the two merged. Routes were available to nearly every part of the city and few people lived more than a half a mile to the nearest stop (La Crosse City Atlas 1893). In 1893 the horse drawn carts were replaced with electric streetcars. The electric cars were cheaper to operate, had a larger capacity and could go longer distances. Because of this, the routes were extended in all directions to the furthest reaches of the city (La Crosse Histories 35). After the great depression, the streetcar system was still in use and maintained high levels of ridership. However, in 1949 the city council called for a more "modern" transportation system and requested that the streetcars to be replaced by busses (La Crosse Histories 43). The old streetcars were sold, and six of them were purchased by a local farmer to house peacocks (Carr 29). While it may have seemed like a good idea at the time, the switch to busses created a sharp decline in the use of mass transit. Busses could not effectively reach the newest developments which were occurring with very low population density. Mass transit systems simply do not work well in areas with a lot of sprawl. This is because people are too spread out to fully patronize a specific bus route, and often the walking distance to get to a bus stop can be quite considerable. Also, bus systems lack the sense of permanence that rail lines have. Rails are always in place, as a constant reminder of the transit system while busses are only visible during their infrequent stops. In 1971, the city bus service, then privately owned, announced that it would need an infusion of public funds or it would be forced to shut down. After several years of partial public funding, the city acquired a federal grant to establish a city owned bus service (La Crosse Histories 45). Bus ridership decreased steadily. A study was done in 1972 which showed that as the number of cars owned increases, the number of trips taken on the city bus decreases (Interim Transit Element 17). What was once a very profitable business is now a source of expense to the city. La Crosse recently purchased a "trolley" style bus which drives a route though downtown much like the old streetcars used to.
Evaluation of the Causes of Urban Sprawl
During the great depression, population density increased. This is reflected in the data displayed in Appendix G. The reasons for this are most likely a lack of new developments to support an increasing population. With 24.9% unemployment, there was not much money to invest in new developments. One way in which the city did manage to expand during the depression was with the construction of the municipal airport. The airport was built primarily to provide a source of employment rather than for the sake of aviation (Bice 45). The airport alone added 1.5 square miles to the city (City of La Crosse, WI (2002)). After 1940, the population density of the La Crosse area fell sharply. This is most likely due to post WWII developments.
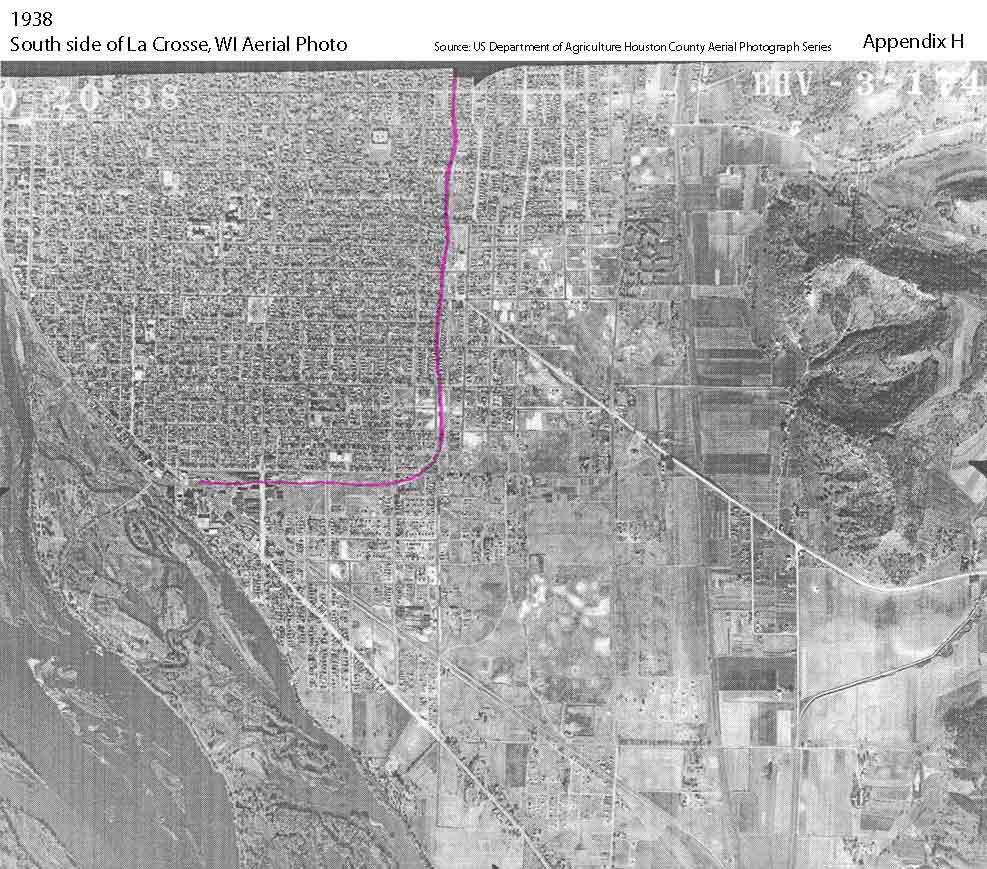
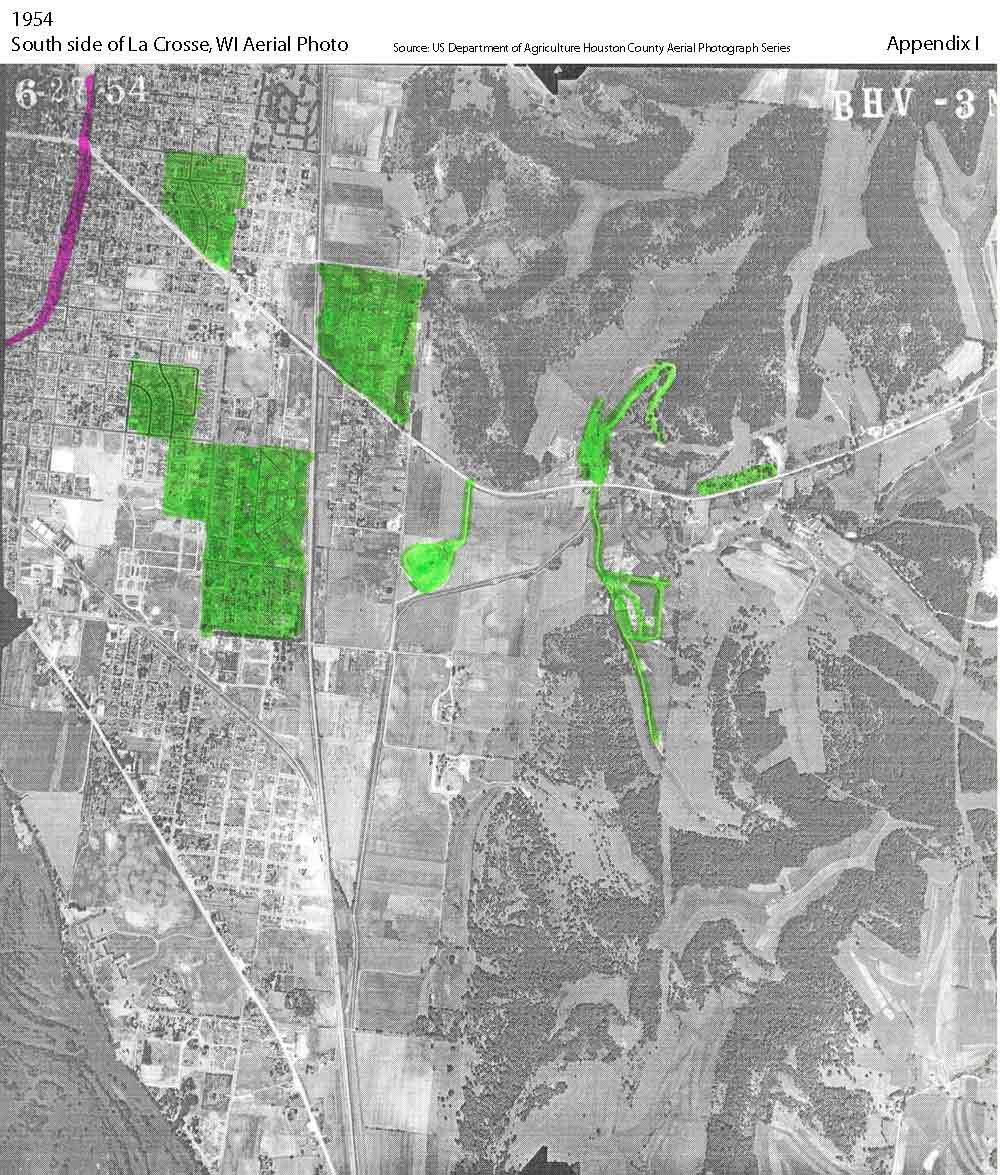
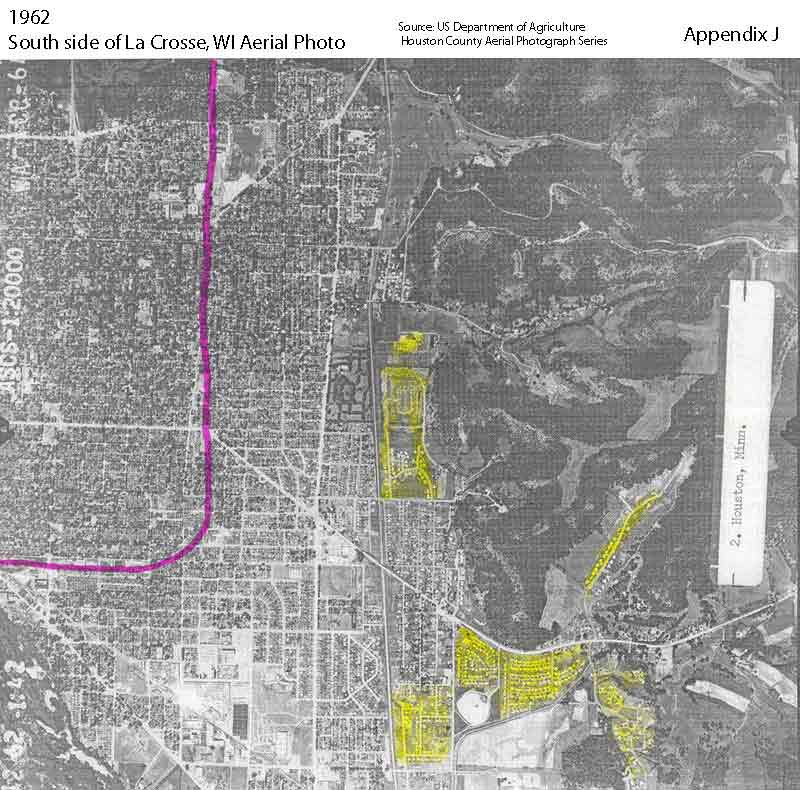
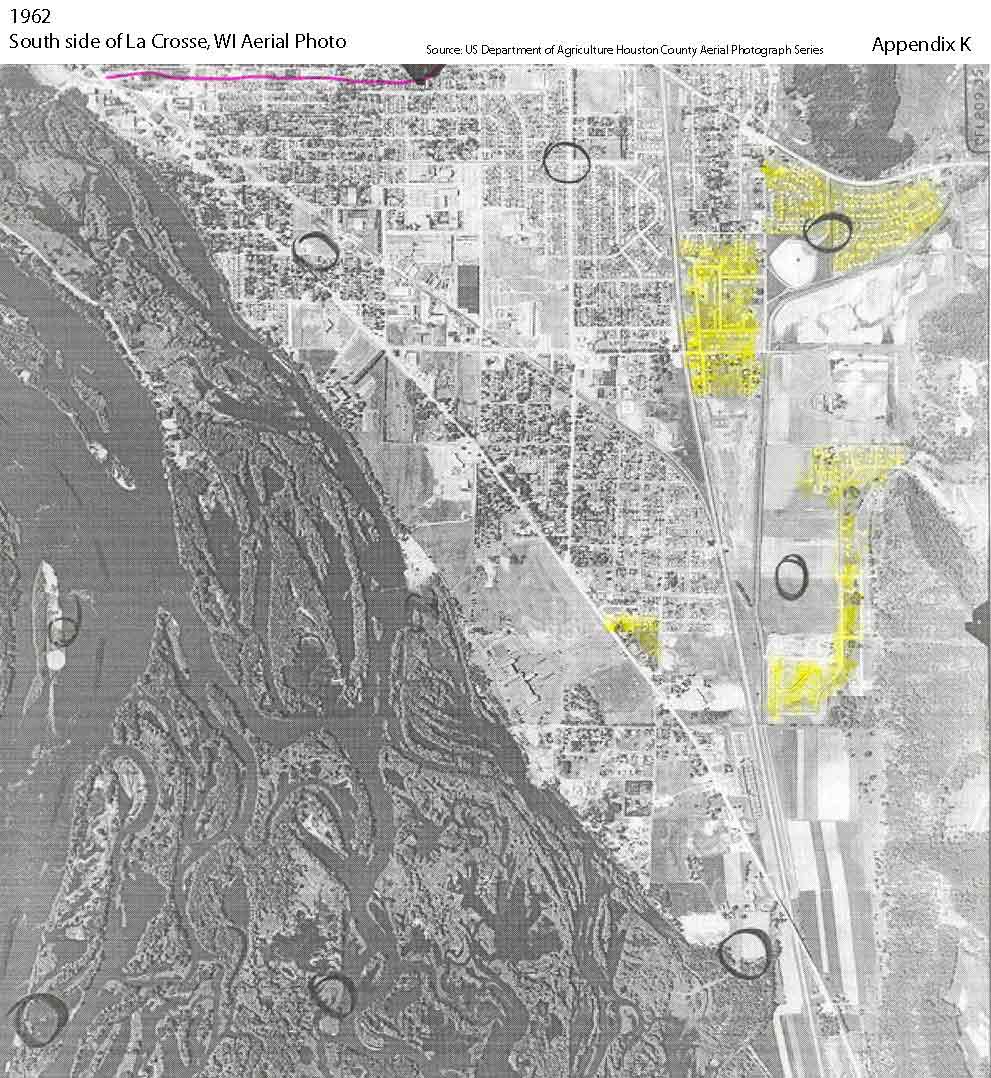
The style of post World War II development contrasts sharply with that of the decades prior. During the 50's, many areas outside the city began to see residential and commercial developments. These can be clearly seen in Appendix H, Appendix I, Appendix J, and Appendix K which show aerial photographs from 1938, 1954, and 1962 of the same section of the south side of La Crosse. Each aerial photograph the new developments have been highlighted. It is important to note that these new developments were not adjacent to any existing areas of the city. This is much different than earlier developments that simply extended the grid plan to open more area. Because these areas were outside the city limits, they were outside of the jurisdiction of the city planners, and they did not have to conform to a grid. Appendix I clearly shows the sharp break between the existing city and the new developments. These new developments tended to utilize curving streets and cul-de-sacs. Because different areas were developed at different times, little attention was paid to the way in which streets would connect. Eventually, as the city expanded in size, the areas of land in between were developed as well, and new areas were annexed to the city (United States Census 1950). The result was a series of disjointed developments that often have awkward and confusing street layouts. Notice the convoluted street patterns near the 15th ward marker on the fold out map (O-35). These disjointed and road intensive developments require more land per person to develop, which would explain the sharp decrease in population density after WWII.
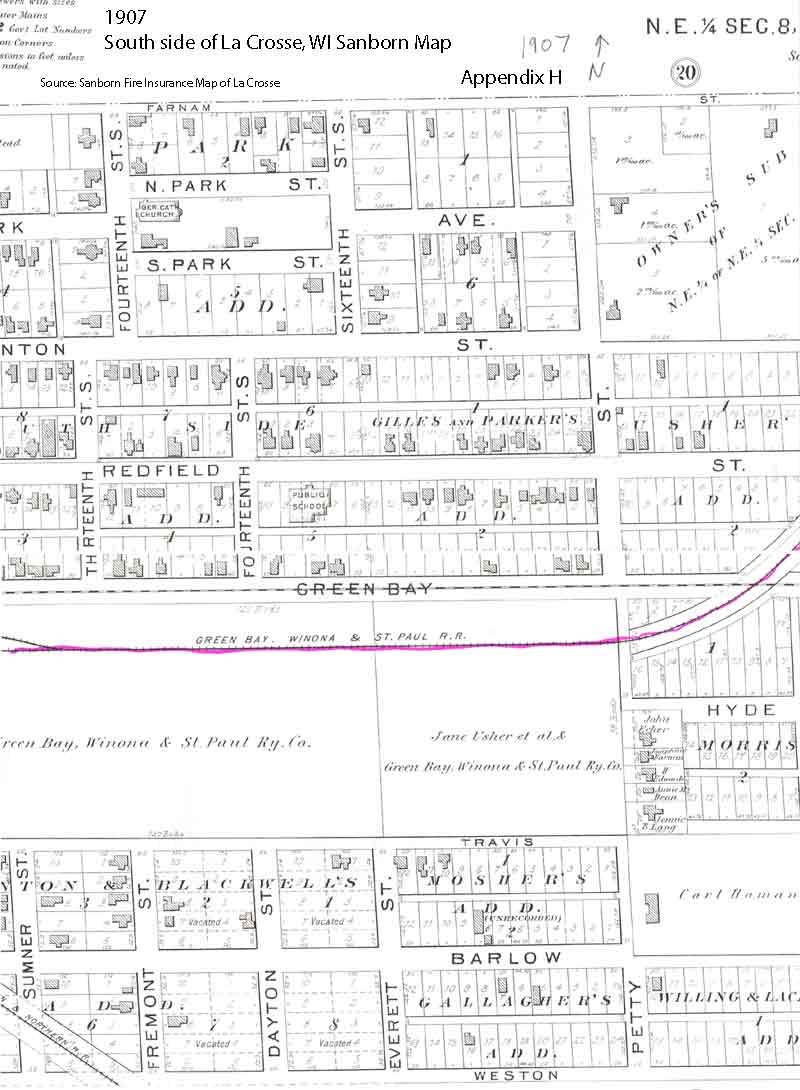
Much of post WWII development could be considered organic in that the end result was not planned but rather developments were built according to what worked best with the situation. Many developments were laid out around features which no longer exist. For example, the developments in the northeast corner of Appendix K were centered on a drive in theater which is now gone. The driveway to the old drive in is now a road called Drive In Road (large fold out map O-32). Also, on all maps an old rail line which no longer exists is drawn in pink. The original rail line is shown in Appendix L. In Appendix J, it is possible to see the band of industrial developments along the southern leg which continue to separate two residential neighborhoods long after the rails were removed. While organic growth can facilitate very dense developments, in this case the lack of centralized planning only accelerated the rate at which land was used.
Post WWII developments also tended to use significantly larger lot sizes than prior developments. This can be clearly seen in Appendix I where all of the new developments have substantially larger front and back yards than the rest of the city. This, combined with a lack of sidewalks and their distance from the city center, helped to fuel the demand for automobiles. As automobile use increased, so did the space necessary for roads and parking. As traffic increased, wider roads were necessary. Note the difference between Appendix H (1938) and Appendix J (1962) in the appearance of major roads. The increase in lot size had a major effect on population density.
The Interstate highway was built through the north side of La Crosse during the 1960s. This attracted some businesses northward to be in closer proximity to the highway. It also spurred growth in the city of Onalaska to the north. By 1970, most of the usable land in the city of La Crosse had been developed. This led to the stabilization of population in the city of La Crosse. At the same time, the population of Onalaska and other surrounding areas was skyrocketing. Between 1970 and 1980 the population of Onalaska increased by 87% to 9249. This helps to explain the growth of the suburbs seen in Appendix D and Appendix E. The new developments in Onalaska had all of the characteristics of urban sprawl. They were not near any commercial center, they were large houses built on oversized lots, and they didn't have sidewalks or mass transit connections. These developments were dependent entirely on the automobile.
By 1980, the several strip malls on the northern and southern extremes had opened up as well as a large regional mall near the interstate. The opening of this larger mall had an immediate impact on the city. All of the large department stores that had previously been located downtown relocated into the mall (Bice 226). The downtown businesses began to suffer with the loss of the larger department stores, and many closed. Industry began moving out of the downtown area and into specialized industrial parks which were several miles from the rest of the city. These developments further increased the dependence of La Crosse on the automobile as a means of transit. They also helped to decrease population density. This trend can be seen in Appendix G. According to a survey in 1984 by the La Crosse Planning committee, only 10% of the population used some form of transit other than the automobile for their commute to work (Bicycle and Pedestrian Plan Element 4). By this time, La Crosse had become completely dominated by the automobile.
Effects of Urban Sprawl
While the lure of the automobile is its door to door transit opportunities, it is not as efficient as many people think. First of all, cars cost quite a bit more than any other form of transportation. When insurance, maintenance, licensure, fuel and purchase cost are combined they can make up a sizable portion of a families income. Cars are also less safe than many other forms of transit. There are also environmental implications. Not only do automobiles release air pollutants, the salt used on roads in the winter and the fluid that leaks from cars ends up in surface runoff which affects stream water quality. Another disadvantage of an automotive based society is the loss of social interaction. No longer can one take an evening stroll to the corner grocery store to get some bread and visit with neighbors sitting on their porches. For people living in new developments were urban sprawl is present, a loaf of bread requires at least a two mile, ten minute commute by automobile. In a living environment scaled for cars and highways, walking is almost impossible, and driving is very impersonal (Sprawl Defined). The requirement of automobiles has an especially hard impact on the poor and elderly who can't afford cars, and who are isolated from jobs and shopping in their homes.
The government must provide more and extended infrastructure to all new developments. This amounts to a significant cost to taxpayers. If new development was limited to the downtown area, new roads and utility lines would not have to be created, but rather the time and money could be invested into maintaining the existing infrastructure. The cost to tax payers is not just limited to new roads and power lines, however. Police and Fire protection becomes less efficient as cities become more spread out. Also, public transportation suffers as the number of routes required to serve a city goes up while the number of riders decreases. All of these costs add up quickly. If urban sprawl were reduced, taxes would go down.
The 1990s saw the further development in the form of strip malls and suburban commercial centers. Many neighborhoods in Onalaska became full, and Onalaska experienced less population and area growth than the decade before. This is similar to what had happened in La Crosse twenty years prior. New developments opened up in a second ring of communities even further from the center of La Crosse. Currently, Holmen, West Salem, La Crescent, MN and Coon Valley are feeling the pressures of urban sprawl.
Alternatives to Urban Sprawl
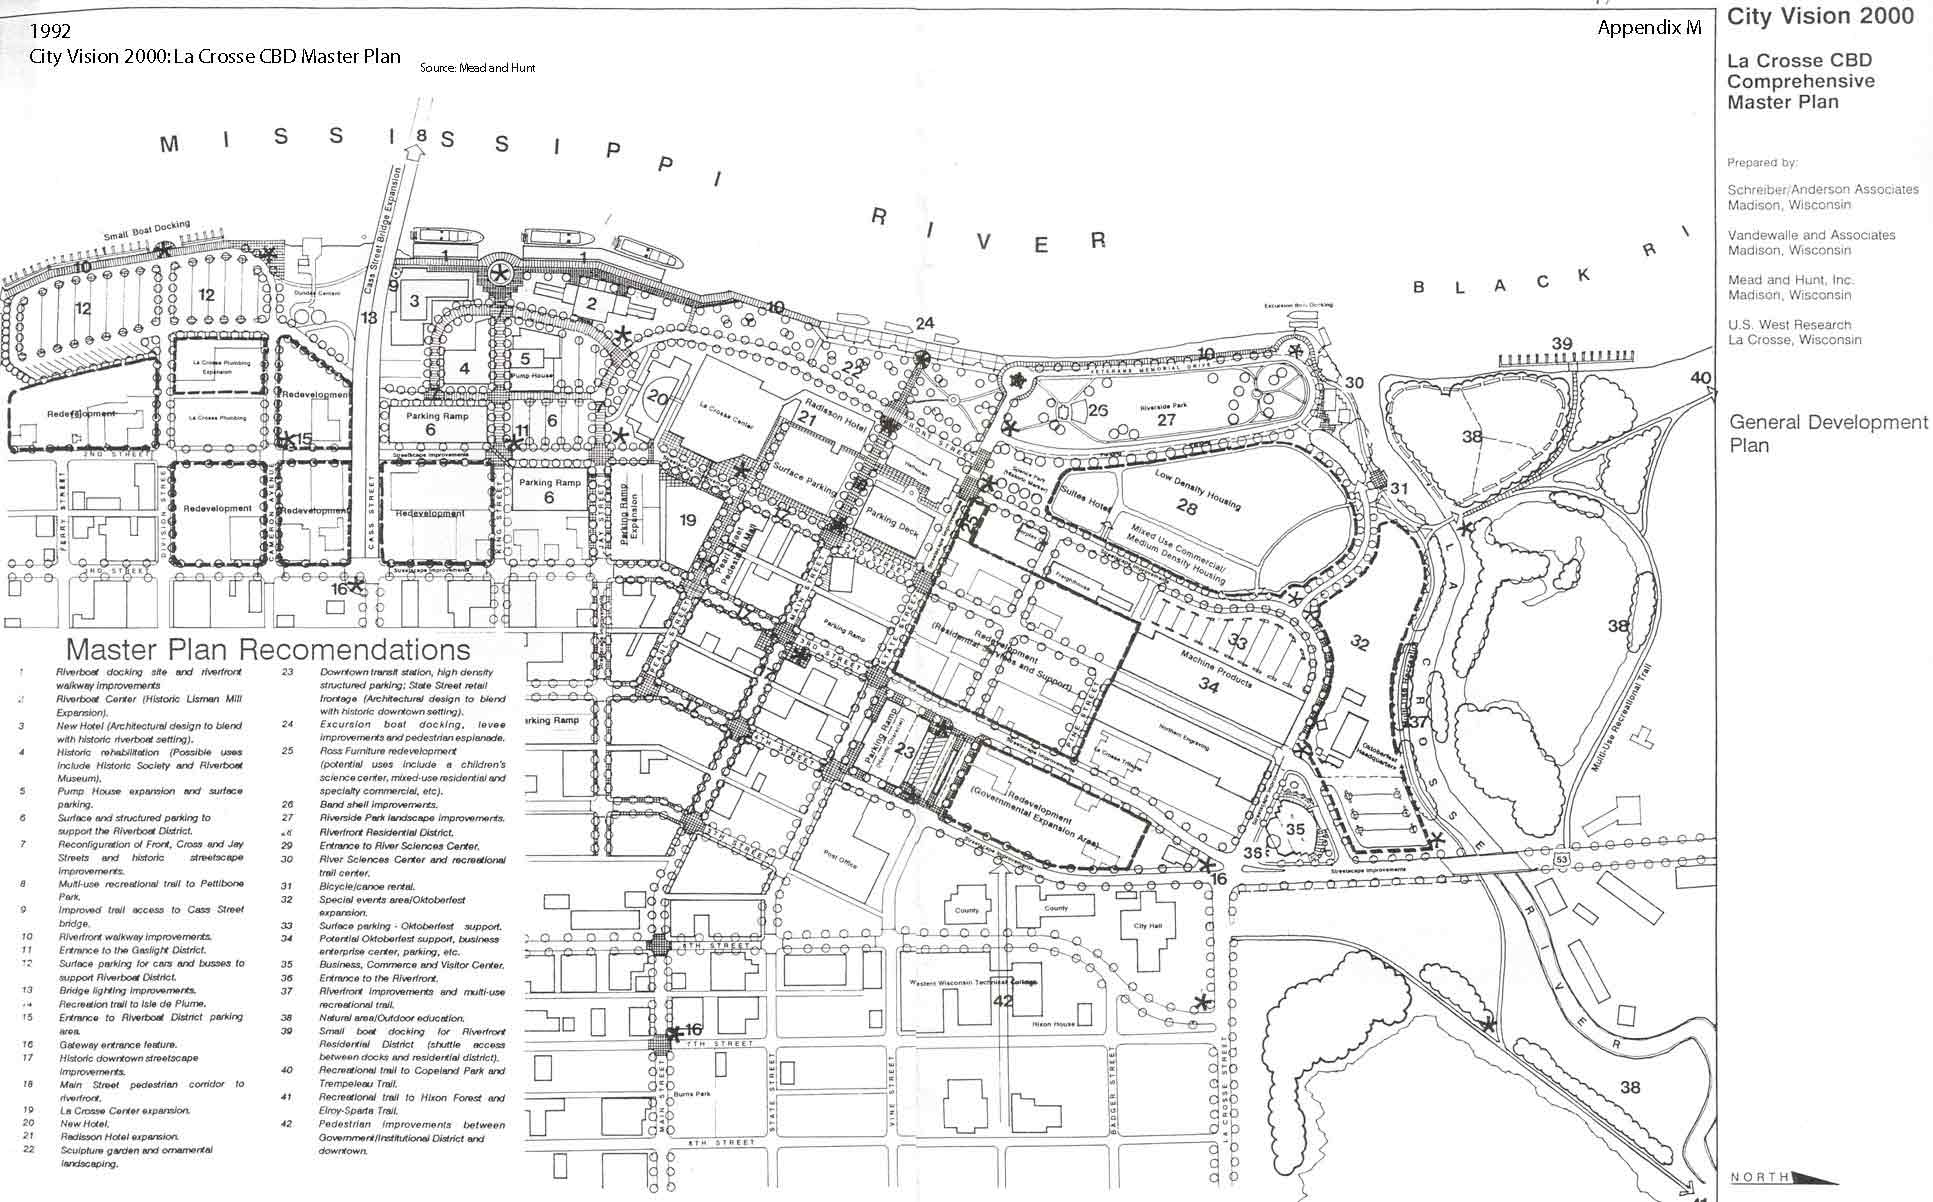
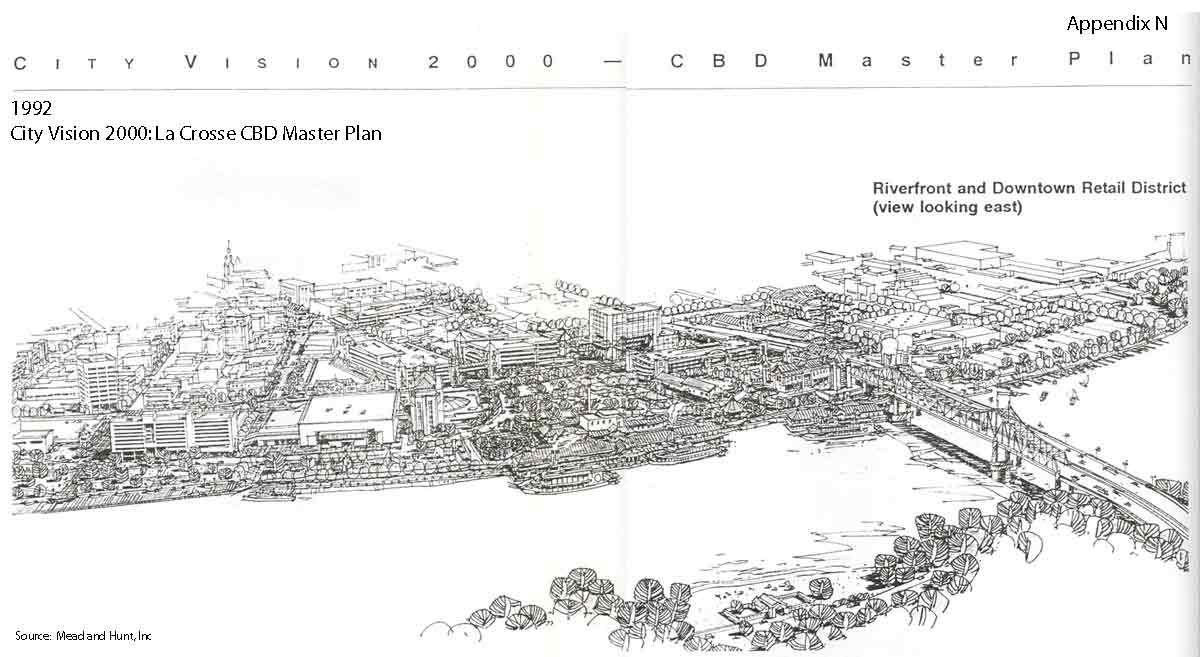
The newest developments planned for the La Crosse area provide another radical shift. The city planning department developed a plan to revitalize the central business district. This plan can be seen in Appendix M and a perspective view in Appendix N. The new focus is on tourism, shopping, and eating establishments. In addition, there is an effort to create housing downtown which will help to promote economic activity. The plan shows redevelopment in many downtown areas where older industrial sites currently exist. In addition, the revitalization and creative re-use of historic buildings will help to maintain the uniqueness and charm of the downtown area. The addition of new parking facilities reflects the dominance of the automobile. However, this new development is radically different from any other post WWII development in that it is scaled to pedestrians rather than cars. Streetscaping, parks, and a pedestrian mall will make the downtown area a more attractive place to visit. Also, the new development focuses on the riverfront which in recent years has been ignored. Steamboats rides will be an important part in attracting tourists. La Crosse already has three boat tour companies and one steamboat (History of the Julia Belle Swain). A riverfront bike trail will help to encourage alternative means of transit as well as the new Bus Transit depot (City Vision 2000). New office developments on old industrial sites are planned in an attempt to bring jobs back downtown. If this master plan is implemented, it is likely that population density for the La Crosse area will increase as people move into apartments in the downtown and businesses help to revitalize unused areas. It will help to promote tourism which will fuel further economic development. Also, this plan will add to the quality of life of the citizens of La Crosse through a decreased dependence on the automobile.
While new developments continue to be built along the edge of the city, the data from appendices B-E show a leveling off in the population and the area consumed by development in the last ten years. This could be from the geographic limitations of the city, a decline in economic activity, or a refocusing on central areas of La Crosse. No matter the reason, the period with the greatest amount of urban sprawl seems to have already passed. From the data that I collected it seems that the period from 1960-1970 is the time when the most area was added to the city while the population gains remained low. Urban sprawl continues to the present time, but the rate at which sprawl is occurring is decreasing.
The switch from a pedestrian to an automotive society facilitated the changes necessary to promote urban sprawl in the La Crosse area. After World War Two, rapid development of large areas of land outside of the city spread the population to very thin levels. The population of La Crosse increased steadily until all of the available land was used, at which point the growth shifted to the suburbs. The rate of growth tapered down and new efforts to revitalize older portions of the city surfaced during the 1990s. These efforts focus around the historical aspects of the downtown areas and aimed at restoring a pedestrian rather than automotive scale. Despite urban sprawl and the issues that it entails, La Crosse is still, in the words of Mark Twain, "a choice town".
Works CitedBice, Raymond C. A Century to Remember. Onalaska: Crecent Printing Co., 1993. Bicycle and Pedestrian Plan Element. La Crosse City Planning Committee, 1984. La Crosse Public Library Archive Vault.
Bliss, H.I. A New Map of the City of La Crosse (1869). Map. La Crosse Public Library Archive Vault.
**Bliss, H.I. Map of La Crosse and its Vicinity (1873). Map. La Crosse Public Library Archive Vault.
Bliss, H.I. Map of the City of La Crosse (1880). Map. La Crosse Public Library Archive Vault.
Bliss, H.I. Map of the City of La Crosse (1885). Map. La Crosse Public Library Archive Vault.
Bus Survey Report. La Crosse City Planning Committee, 1972. La Crosse Public Library Archive Vault.
Carr, Spencer. A Brief Sketch of La Crosse, Wisconsin. La Crosse: C. Rogers, 1854, p. 28.
City of La Crosse, WI (2002). Map. City Engineering Department. City Vision 2000: La Crosse CBD Master Plan. Mead and Hunt, Inc, 1992. La Crosse Public Library Archive Vault.
Daoust, Jerry. "The Coming Urban Sprawl." CommerceNow September 1996.
Eighth Census of the United States (1860). Washington DC: Government Printing Office, 1866, p. 350. Fifteenth Census of the United States, Vol. 1 (1930). Washington DC: Government Printing Office, 1933, p. 942.
Fourteenth Census of the United States, Vol. 2 (1920). Washington DC: Government Printing Office, 1922, p. 360.
Hirshheimer, H. J., and Albert H. Sanford. A History of La Crosse, WI 1841-1900. La Crosse, La Crosse Historical Society, 1951.
History of the Julia Belle Swain Steamboat. [Online.] Available: http://www.juliabelle.com/map.html, April 27, 2002.
Houston County (1938). Aerial Photograph Series. US Department of Agriculture. University of Minnesota John R. Borchert Map Library. Mark Hurd Airmapping Corp, WA-5- (602-608).
Houston County (1947). Aerial Photograph Series. US Department of Agriculture. University of Minnesota John R. Borchert Map Library. Woltz Studios, Inc, WA ID (65, 66, 115-117, 124-128).
Houston County (1954). Aerial Photograph Series. US Department of Agriculture. University of Minnesota John R. Borchert Map Library. Woltz Studios, Inc, BHV 3N (64-70 & 90-98).
Houston County (1962). Aerial Photograph Series. US Department of Agriculture. University of Minnesota John R. Borchert Map Library. Park Woltz Studios, Inc, WA-3CC 225 &WA-1CC (62-65).
Houston County (1968). Aerial Photograph Overview. US Department of Agriculture. Park Aerial Services. University of Minnesota John R. Borchert Map Library.
Interim Transit Element. . La Crosse City Planning Committee, 1994. La Crosse Public Library Archive Vault.
La Crecent Quadrangle, 7.5 minute series (1991). Map. US Department of the Interior. University of Minnesota John R. Borchert Map Library.
La Crosse City Atlas (1893). Map. Engineering Department of La Crosse. La Crosse Public Library Archive Vault.
La Crosse City Atlas (1907). Map. La Crosse Public Library Archive Vault.
La Crosse City Ward Map (1890). Map. La Crosse Public Library Archive Vault.
La Crosse Histories of Roads and Transportation Systems. Wisconsin Department of Transportation, 1994. La Crosse Public Library Archive Vault.
La Crosse MTU Riders guide. Pamphlet. La Crosse Municipal Transit Utility, 2002.
La Crosse Quadrangle, 7.5 minute series (1930). Map. US Department of the Interior. University of Minnesota John R. Borchert Map Library.
La Crosse Quadrangle, 7.5 minute series (1956). Map. US Department of the Interior. University of Minnesota John R. Borchert Map Library.
La Crosse Quadrangle, 7.5 minute series (1963, photorevised 1974)). Map. US Department of the Interior. University of Minnesota John R. Borchert Map Library.
La Crosse Quadrangle, 7.5 minute series (1973). Map. US Department of the Interior. University of Minnesota John R. Borchert Map Library.
La Crosse Quadrangle, 7.5 minute series (1993). Map. US Department of the Interior. University of Minnesota John R. Borchert Map Library.
La Crosse Quadrangle, 7.5 minute series (1998). Map. US Department of the Interior. University of Minnesota John R. Borchert Map Library.
Map of the City of La Crosse (1910). La Crosse Public Library Archive Vault.
Map of the City of La Crosse, WI (1900). Map. La Crosse Public Library Archive Vault.
Ninth Census of the United States (1870). Washington DC: Government Printing Office, 1872, p. 291.
Onalaska Quadrangle, 7.5 minute series (1963, photorevised 1974). Map. US Department of the Interior. University of Minnesota John R. Borchert Map Library.
Onalaska Quadrangle, 7.5 minute series (1993). Map. US Department of the Interior. University of Minnesota John R. Borchert Map Library.
Sanborn Fire Insurance Map of La Crosse (1906). Microfiche. Sanborn Map Company. La Crosse Public Library Archive Vault.
Smalley, John. Where Three Rivers Meet: A Pictoral History of La Crosse. Maceline, MO: Heritage House Publishing Co, 1992.
Sprawl Defined. [Online] Available http://www.vtsprawl.org/define/defined.htm, April 26, 2002
Tenth Census of the United States, Vol. 1 (1880). Washington DC: Government Printing Office, 1883, p. 426.
Thirteenth Census of the United States, Vol. 1 (1910). Washington DC: Government Printing Office, 1913, p. 97.
Twain, Mark. Life on the Mississippi.
Twelfth Census of the United States, Vol. 1 (1900). Washington DC: Government Printing Office, 1902, p. 245.
United States Census (1940), Vol. 1. Washington DC: Government Printing Office, 1942, p. 1168.
United States Census (1950), Vol. 1. Washington DC: Government Printing Office, 1952, p. 49-14.
United States Census (1960), Vol. 1. Washington DC: Government Printing Office, 1961, p. 50-12.
United States Census (1970), Vol. 1. Washington DC: Government Printing Office, 1972, p. 50-15.
United States Census (1980), Vol. 1. Washington DC: Government Printing Office, 1982, p. 51-16.
United States Census (1990). Washington DC: Government Printing Office, 1992, p. 6.
US Census Office Compendium of the Eleventh Census (1890). Washington DC: Government Printing Office, 1892, p. 426. Wisconsin Blue Book 2001-2002. Madison, WI: State of Wisconsin, 2001.**